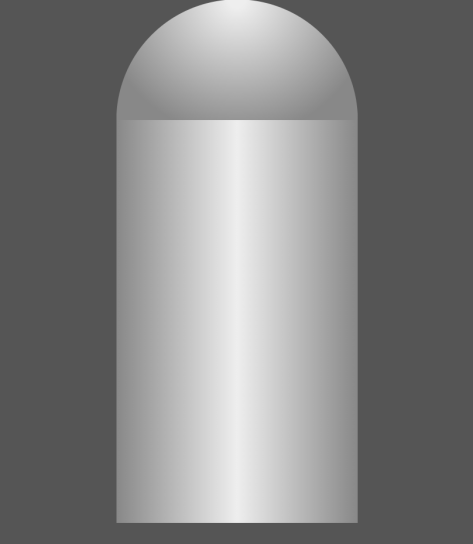
I had previously described a polygon clip path derived from equations.
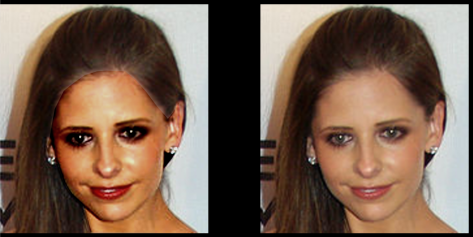
The points for this clip path are traced from an image.
I modified an app I had written to allow it to generate the points for the clip path.
This is the modified code:
<!DOCTYPE html>
<html xmlns=’http://www.w3.org/1999/xhtml’>
<head profile=’http://gmpg.org/xfn/11′>
<title>Bezier</title>
<style type=’text/css’>
body {margin-left:0;margin-right:0;font:normal normal normal 12px Arial;}
a{ text-decoration: }
:link { color: rgb(0, 0, 255) }
:visited {color :rgb(100, 0,100) }
:hover { }
:active { }
.d1{position: absolute; width: 1600px; height: 850px; left: 0; top: 50px}
#canvas{position: absolute; width: 1600px; height: 900px: left: 0; top: 0}
form {position: absolute; width: 1500px; left: 50%; margin-left: -650px;}
#values{position: relative; width: 850px; font:normal normal 700 15px Arial}
#files{position: relative; width: 100px; values font:normal normal 700 15px Arial}
#limt {position: relative; width: 25px; font:normal normal 700 15px Arial}
</style>
</head>
<body>
<div id=’canvas’></div>
<form name=”form1″>
<select id=”radio1″ name=”radio1″ value=”” onchange = ‘getChecked(“1”);’ >
<option>jsDraw2d</option>
<option>Trace Image</option>
</select>
<select id=”radio2″ name=”radio2″ value=”” onchange = ‘getChecked(“2”);’ >
<option>SVG</option>
<option>SVG Poly</option>
<option>CSS Poly</option>
</select>
<input id = “values” type=”text” name=”values” value=”” />
<input type=”file” id = “files” name=”files” value=”test” onchange=’filenme();’ />
<input id = “color” type=”color” name=”color” value=simple color />
# pts
<input id = “limt” type=”text” name=”limt” value=”0″ />
</form>
<div class=”d1″>
<svg width=”100%” height=”100%” xmlns=”http://www.w3.org/2000/svg”>
<defs>
<pattern id=”smallGrid” width=”8″ height=”8″ patternUnits=”userSpaceOnUse”>
<path d=”M 8 0 L 0 0 0 8″ fill=”none” stroke=”gray” stroke-width=”0.5″/>
</pattern>
<pattern id=”grid” width=”80″ height=”80″ patternUnits=”userSpaceOnUse”>
<rect width=”80″ height=”80″ fill=”url(#smallGrid)”/>
<path d=”M 80 0 L 0 0 0 80″ fill=”none” stroke=”gray” stroke-width=”1″/>
</pattern>
</defs>
<rect width=”100%” height=”100%” fill=”url(#grid)” />
</svg>
</div>
<select id=”fldr” name=”fldr” style=”position: absolute; left: 400px; top: 2px; ” >
<option>Choose Folder</option>
<option></option>
<option>A-E/</option>
<option>F-J/</option>
<option>K-O/</option>
<option>P-R/</option>
<option>S-T/</option>
</select>
http://jsDraw2D.js
<script type=”text/JavaScript”>
var IE = document.all?true:false;
if (!IE) document.captureEvents(Event.MOUSEMOVE)
document.onclick = getMouse2;;
document.onmousemove = getMouseXY;
var tempX = 0;
var tempY = 0;
var lim = 0;
var cl = “”;
var cnt = 0;
var fname = “”;
var px = new Array(0,0,0,0,0,0,0,0,0,0,0,0,0,0,0,0,0,0,0,0,0,0,0,0,0,0,0,0,0,0,0,0,0,0,0,0,0,0,0,0);
var py = new Array(0,0,0,0,0,0,0,0,0,0,0,0,0,0,0,0,0,0,0,0,0,0,0,0,0,0,0,0,0,0,0,0,0,0,0,0,0,0,0,0);
var col = new jsColor(“red”);
var col2 = new jsColor(“blue”);
var pen = new jsPen(col,3);
var on = false; var str2 = “”;
var gr = new jsGraphics(document.getElementById(“canvas”));
var radiovalue; var ini = 0;
function filenme() {
if (document.getElementById(“files”).value != “” && document.getElementById(“files”).value != “Choose File”) fname = document.getElementById(“files”).value;
fname = fname.substr(fname.lastIndexOf(“\\”) + 1);
fname = document.getElementById(“fldr”).value + fname;
}
function getChecked(l) {
if (l == “1”) radiovalue = document.form1.radio1.value;
if (l == “2”) radiovalue = document.form1.radio2.value;
if (radiovalue == “CSS Poly”) {
document.getElementById(“values”).value = document.getElementById(“values”).value.replace(‘style=”fill: ;stroke: ;stroke-width: ” />’,”);
document.getElementById(“values”).value = document.getElementById(“values”).value.replace(‘<polygon points=”‘,”);
document.getElementById(“values”).value = document.getElementById(“values”).value.replace(new RegExp(‘,’, ‘g’),’px ‘);
document.getElementById(“values”).value = document.getElementById(“values”).value.replace(new RegExp(‘” ‘, ‘g’),’px,’);
}
if (radiovalue == “Trace Image”) gr.drawImage(fname, new jsPoint(0,40));
document.getElementById(“fldr”).style.visibility=”hidden”;
}
function drawPolyBezier() {
gr.fillRectangle(new jsColor(“white”),new jsPoint(0,40) , 1600,900);
var points = new Array();
if (radiovalue == “SVG Poly” ) {
for (var i = 0; i < lim; i ++) {
if (py[i] > 40 && lim > 1) {
points[i] = new jsPoint(px[i], py[i]);
gr.fillCircle(col2, points[i], 3);
}
}
}
if (radiovalue == “SVG Poly”) {
gr.fillPolygon(new jsColor(“#EEFFF8”), points);
gr.fillPolygon(new jsColor(cl), points);
gr.drawPolygon(new jsPen( new jsColor(“black”),3), points);
}
}
for (var i = 0; i < lim; i ++) {
if (py[i] > 40 && lim > 1) {
points[i] = new jsPoint(px[i], py[i]);
gr.fillCircle(col2, points[i], 6);
}
}
function getMouse2(e) {
cl = document.getElementById(“color”).value;
if (cnt < 2) lim = parseInt(document.getElementById(“limt”).value);
if (lim > 1 ) {
if (on ) {
on = false;
} else if (cnt > lim) {
on = true;
}
tempX = e.pageX;
tempY = e.pageY;
if (tempX < 0){tempX = 0;}
if (tempY < 0){tempY = 0;}
if (tempY > 40) cnt ++;
if (cnt <= lim) document.getElementById(“values”).value = cnt;
if (radiovalue == “SVG Poly”) {
if ( cnt <= lim) {
px[cnt – 1] = tempX;
py[cnt -1]= tempY;
gr.fillCircle(col2, new jsPoint(px[cnt – 1] , py[cnt – 1]), 3);
if (cnt == lim) drawPolyBezier();
}
}
}
return true;
}
function getMouseXY(e) {
if (cnt > 1 && on && lim) {
tempX = e.pageX;
tempY = e.pageY;
if (tempX < 0)tempX = 0;
if (tempY < 0)tempY = 0;
if ( radiovalue == “SVG Poly”) ini = 0;
for (var j = ini; j <= lim; j ++) {
if ((Math.abs(tempX – px[j]) < 5 && Math.abs(tempY – py[j]) < 5) ) {
px[j] = tempX;
py[j] = tempY;
}
}
var str2 = “”;
if (radiovalue == “SVG Poly”) str2 = str2 + ‘<polygon points=”‘;
for (var i = 0; i <= lim + 1; i ++) {
if (py[i] > 40 && radiovalue == “SVG Poly”) str2 = str2 + px[i].toString() + ‘,’ + (py[i] – 40).toString() + ‘” ‘;
}
if (radiovalue == “SVG Poly”) str2 = str2 + ‘style=”fill: ;stroke: ;stroke-width: ” />’ ;
document.getElementById(“values”).value = str2;
str2 = “”;
if (radiovalue != “CSS Poly”) drawPolyBezier();
}
if (cnt == lim) on = false;
return true;
}
</script>
</body></html>
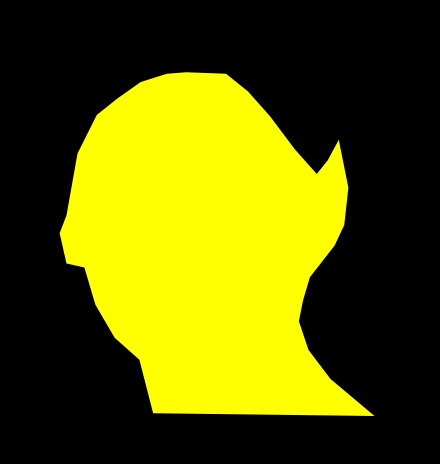
This is a tracing of a part of an image when set to clip a division:
This is the code:
<!DOCTYPE html>
<html>
<title>Mask</title>
<style>
body {margin-left:0;margin-right:0;font:normal normal 600 28px Arial;background: black; color: DarkViolet}
a{ text-decoration: }:link { color: rgb(0, 0, 255) }:visited {color :rgb(100, 0,100) }:hover { }:active { }
</style>
</head>
<body>
<div id=”d1″ style=”position: absolute; width: 500px; height: 500px; background: yellow” ></div>
<script>
var str = “”;
str = ‘163px 102px,192px 103px,208px 116px,224px 134px,242px 158px,258px 176px,266px 166px,274px 151px,281px 186px,278px 213px,271px 228px,253px 251px,248px 268px,245px 283px,252px 304px,268px 325px,300px 352px,139px 350px,129px 311px,111px 295px,97px 271px,89px 244px,76px 241px,71px 219px,76px 206px,84px 161px,98px 133px,113px 121px,130px 109px,149px 103px,’;
str = str.substr(0,str.length – 1);
document.getElementById(“d1”).style.clipPath = “polygon(” + str + “)”;
</script>
</body></html>
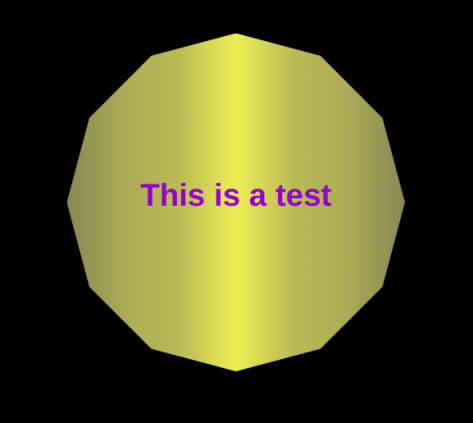
As before, the clip path is added to the division style:
str = ‘163px 102px,192px 103px,208px 116px,224px 134px,242px 158px,258px 176px,266px 166px,274px 151px,281px 186px,278px 213px,271px 228px,253px 251px,248px 268px,245px 283px,252px 304px,268px 325px,300px 352px,139px 350px,129px 311px,111px 295px,97px 271px,89px 244px,76px 241px,71px 219px,76px 206px,84px 161px,98px 133px,113px 121px,130px 109px,149px 103px,’;
str = str.substr(0,str.length – 1);
document.getElementById(“d1”).style.clipPath = “polygon(” + str + “)”;